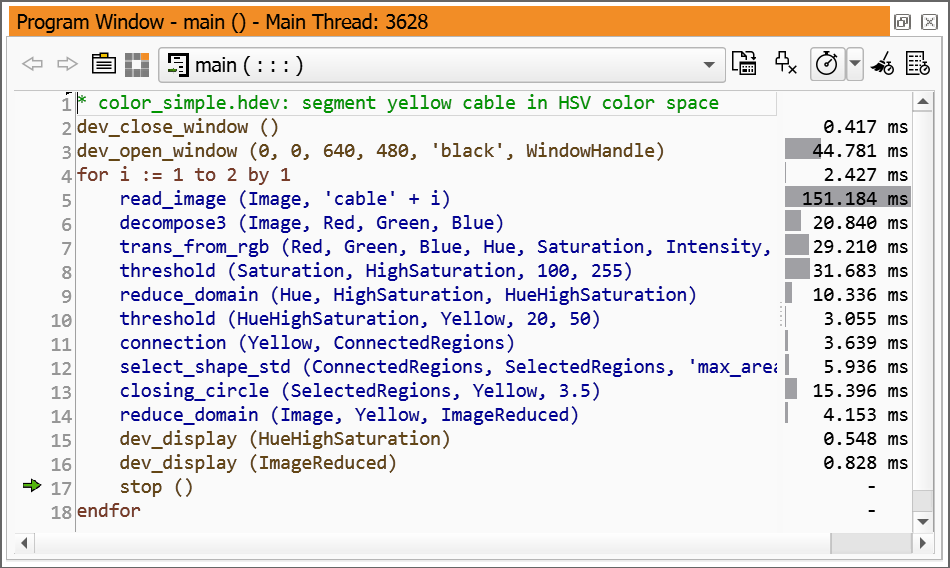
Figure 6.65: Selecting program lines in the profiler.
The profiler collects data for all executed program lines. In general, the collected data is also displayed in the program window and the runtime statistics window. This behavior is not always desirable. In many cases, the runtime statistics of only a small portion of the program code is relevant when evaluating its performance. Accordingly, the display of profiler data in both the program window and the runtime statistics window can be restricted to a selection of profiler lines.
Profiler lines can be selected in three different ways:
In all cases, the selection is also highlighted in the left part of the program window until the mouse button is released. This visualization supports you in selecting the desired program lines, which can be difficult if the program window is very wide.
The values of the selected profiler lines are summed up and displayed in the status bar as shown in figure 6.66.
To display the profiler data of only the selected lines, click Activate Only selected in the context menu of the profiler area. The result is shown in figure 6.67. Note that the gray bars are automatically adjusted to the selected data.
To toggle the status of specific profiler lines, select the corresponding lines as described above and click Activate/Deactivate Display in the context menu of the profiler area.
The runtime statistics window is updated to list only activated program lines as shown in figure 6.68. To remove additional lines from this window, select the corresponding lines and click the button. Deactivated lines can be re-displayed in light gray if the button is turned on.